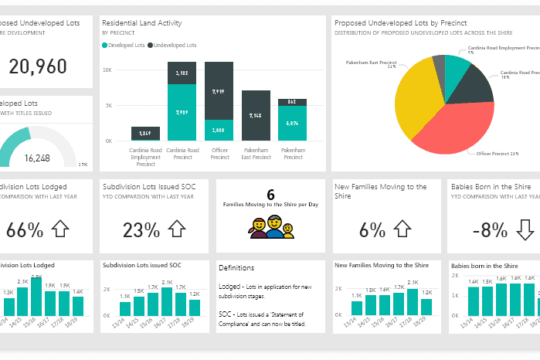
Microsoft PowerBI is the most popular business intelligence used by data analysts and business intelligence developers.
Discover how to quickly glean insights from your data using Power BI. The business analytics tools—which include the Power BI service, Power BI Desktop, and Power BI Mobile—can help you more effectively create and share impactful visualizations with your colleagues and company.
This course will teach you to master the most important concepts of Power BI.
This course is hands-on with experienced instructors and practical, real-world exercises.
CURRICULUM
This course can be split into 5 key areas:
Loading and Transforming Data
- Connecting to data sources in Power BI
- Transforming Columns in your Query
- Adding Columns to your Query
- Sorting and Filtering
- Grouping and summarising your data
- Pivoting and Unpivoting your data
Data Modelling
- Table Relationships
- One to Many, One to One and Many to Many Cardinality
- “Active” vs “Inactive” Relationships
- STAR and SNOWFLAKE Modelling Approaches
- Dimensions and Fact Tables
Visualizations and Charts
- Visualization and Report Basics
- Tables and Pivot Tables
- Matrix Visuals
- Bar and Column Charts
- Line and Area Charts
- Cards
- Data Categories and Geographical Charts
- Report Design Best Practice
Power BI Service
- Power BI Pro vs Premium Overview
- Power BI Pro Interface Tour
- Publishing Reports to Power BI Pro
- Personal Workspaces
- Dashboards
Data Analysis Expressions (DAX)
- Overview of the Languages used in Power BI (M and DAX)
- DAX Syntax Basics
- Aggregation Functions
- Filter Functions
- Other Functions
COURSE PROJECT
We will be using a GetFlix video streaming to create an interactive report with some amazing visualizations.
- Connect to various data sources including csv, excel, JSON and more.
- Perform extensive data transformations to make our data ready for reporting.
- Use relationships and data modelling methodologies to create an effective data model.
- Explore all kinds of visualisations from Column Charts, Scatter Charts, Maps, Tooltips and more.
- Use visual elements like action icons and buttons to navigate between pages in your report.
- Explore the capabilities of Power BI Pro and how it can enable you to collaborate within your Organization
- Leverage Data Analysis Expressions to add insight and analysis to our Power BI Report
You should gain more than enough experience to add value to your real world projects!
Who this course is for:
- Anyone interested in building a business intelligence solution end to end
- Anyone looking to pursue a career in data analysis or business intelligence.


